How crypto futures markets are feeding ‘scam coin’ insider pump and dumps
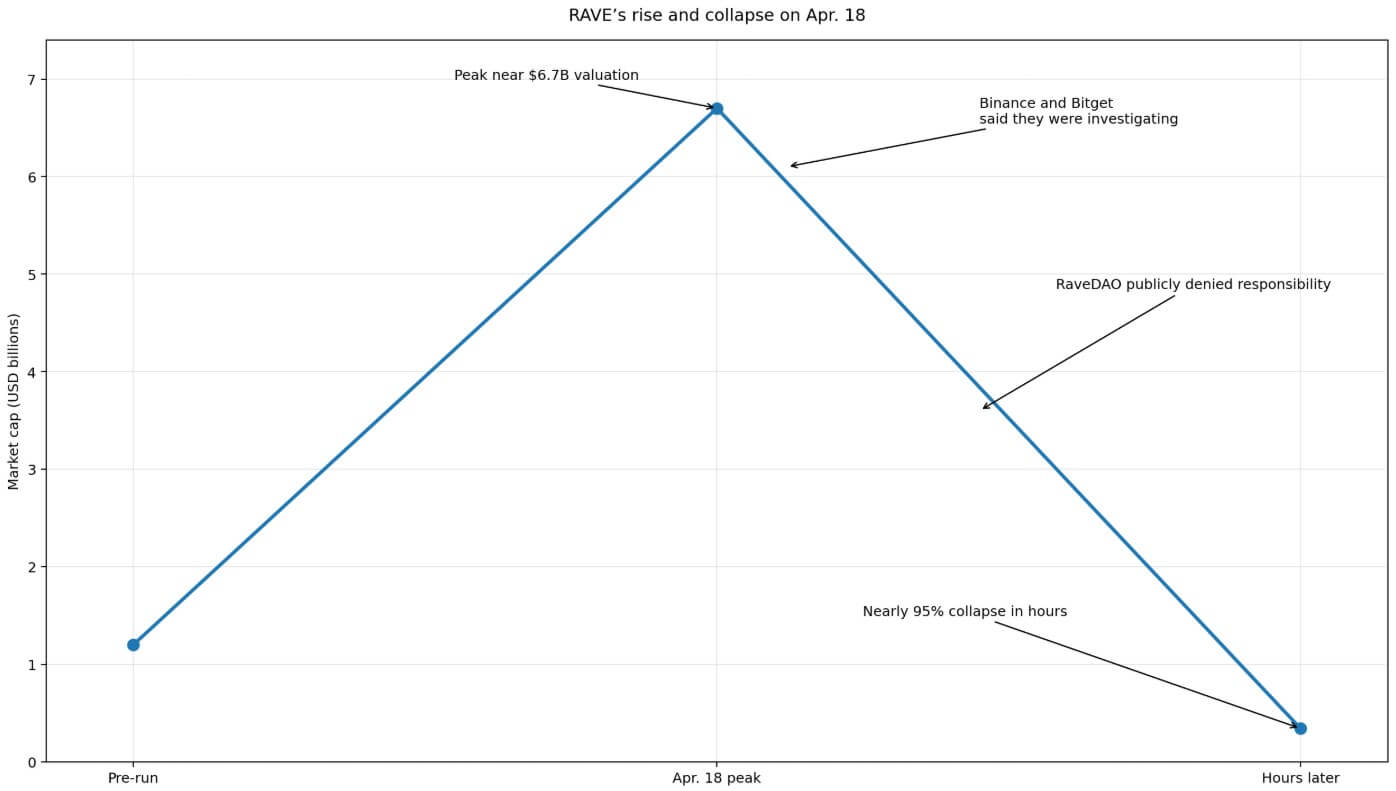
RAVE briefly crossed a $6.7 billion valuation on Apr. 18 before collapsing nearly 95% in hours. The market infrastructure surrounding the token, consisting of thin float, concentrated supply, and a live perpetual market, drove the scale of both the rally and the destruction.
ZachXBT alleged that insiders controlled more than 90% of RAVE’s supply, with roughly 75% in a single wallet and approximately 10% more spread across two connected wallets.
Binance and Bitget both publicly acknowledged they were investigating, and OKX’s Star Xu stated that his exchange’s risk engine registered no disruption and added a $25,000 bounty to support ZachXBT’s investigation.
RaveDAO publicly denied responsibility.
The mechanism
What traders call “scam coins” is often a repeatable derivatives structure.
The loop runs when a token with concentrated supply and a tiny effective float receives a perpetual market listing. Bearish traders pile into shorts, and a small push in thin spot liquidity triggers forced buying that sends the price vertical.
When the token’s valuation increases severalfold, concentrated holders sell into that forced bid.
Binance’s own Mar. 25 market maker red flags guide explicitly warned about coordinated sell-offs across platforms, volume that does not match price behavior, price spikes in thin liquidity, and shallow order books that make prices easier to push artificially.
CoinGlass data from the post-crash period shows approximately $3.36 billion in 24-hour futures volume versus $138.9 million in spot volume, a 24.7x derivatives-to-spot ratio. Open interest of roughly $105.7 million represented about 67.3% of the market cap.
If roughly 85% of supply could not realistically trade, RAVE’s open interest exceeded the mark-to-market value of its effective float.
Using CoinGlass’ post-crash price of approximately $0.625, 15% of a one-billion-token supply yields an effective float of approximately $93.8 million, which is lower than the $105.7 million in open interest sitting on top of it.
That data point falls short of proving manipulation, but it describes a market in which derivative exposure had outgrown the cash market beneath it.
The same structure for three different tokens
On Mar. 23, SIREN’s open interest climbed to approximately $105 million before retreating to $65 million as short positions faced liquidation. Binance and Bybit together recorded roughly $7.1 million in liquidations during that period.
More than 59% of positions still leaned short once the initial squeeze concluded, leaving the market structurally exposed to another round of forced covering.
Phemex reported that one wallet cluster controlled roughly 88% of SIREN’s supply and flagged a funding rate of -0.2989%, one of the clearest visible signs of a crowded-short setup. CoinGlass now places SIREN’s futures-to-spot turnover at approximately 40.5x.
A deeply negative funding rate means short-position holders pay longs to maintain their trades. When that condition coexists with concentrated spot supply and thin real float, price discovery effectively moves to the derivatives layer, and whoever controls the cash market can choose when to squeeze.
ARIA illustrates the exit side, as the token addresses suspected of manipulating ARIA sold 45.64 million tokens for approximately 5.42 million USDT. The token fell 91%, with market cap collapsing from roughly $315 million to $38.5 million.
Even with that collapse behind it, CoinGlass shows ARIA’s futures-to-spot turnover at approximately 12.0x, with open interest at roughly 77.7% of remaining market cap.
RAVE, SIREN, and ARIA map the same investigative structure, the squeeze in progress, and the post-dump residue at three different moments.
| Token | Stage in the loop | Supply concentration | Futures/spot ratio | OI / market-cap signal | Key squeeze/dump evidence | Outcome |
|---|---|---|---|---|---|---|
| RAVE | Investigative structure / scandal phase | ~75% in one wallet; ~10% in two connected wallets; ~85% estimated out of public circulation | 24.7x | OI ~$105.7M vs. effective float ~$93.8M — derivatives exceeded the tradable cash market | ZachXBT alleged insider control of 90%+ of supply; pre-rally exchange deposits; 32M-token withdrawal during rally; Binance and Bitget launched investigations | Peaked at ~$6.7B valuation; collapsed ~95% in hours |
| SIREN | Squeeze in progress | One wallet cluster controlling ~88% of supply | 40.5x | OI reached ~$105M at squeeze peak; fell to ~$65M after liquidations | Funding rate of -0.2989% (extreme crowded-short signal); ~$7.1M liquidated across Binance and Bybit; 59%+ of positions still short post-squeeze | Squeeze executed; market remained majority-short and structurally exposed to repeat |
| ARIA | Post-dump unwind | Not publicly disclosed | 12.0x | OI ~77.7% of remaining market cap after collapse | On-chain analysts identified wallets that sold 45.64M tokens for ~5.42M USDT into the forced bid | Fell 91%; market cap dropped from ~$315M to ~$38.5M |
The infrastructure enabling the most effective moves in each episode runs through venues that had already published guidance explicitly describing those very moves.
Binance’s Mar. 25 guide and its public acknowledgment of the RAVE investigation both come from the same institution managing the same business tension. Listing volatile, thin-float assets with perpetual markets generates fee revenue at scale.
The 24.7x, 40.5x, and 12.0x futures-to-spot ratios for RAVE, SIREN, and ARIA also represent revenue figures. Futures volume on RAVE alone hit roughly $3.36 billion in a single day post-crash.
Exchanges can point to surveillance and investigation as evidence of responsibility, while retail traders can point to the listings themselves as evidence of the opposite.
Two paths from here
If venues adopt float-aware listing standards, with minimum circulation thresholds, wallet-concentration screens, and lower leverage caps on thin-book assets, the frequency of these episodes drops.
Binance’s Mar. 25 red flag framework already gives exchanges a ready-made rationale for such requirements.
The constructive case rests on RAVE becoming the episode that moves listing standards from informal guidance to enforceable policy, because the reputational cost of another high-profile investigation finally exceeds the listing fee revenue.
The opposite path is equally coherent, as the incentive structure that produced RAVE, SIREN, and ARIA is intact. Concentrated holders can repeatedly use exchange deposits, narrative catalysts, and crowded short positioning to force liquidations.
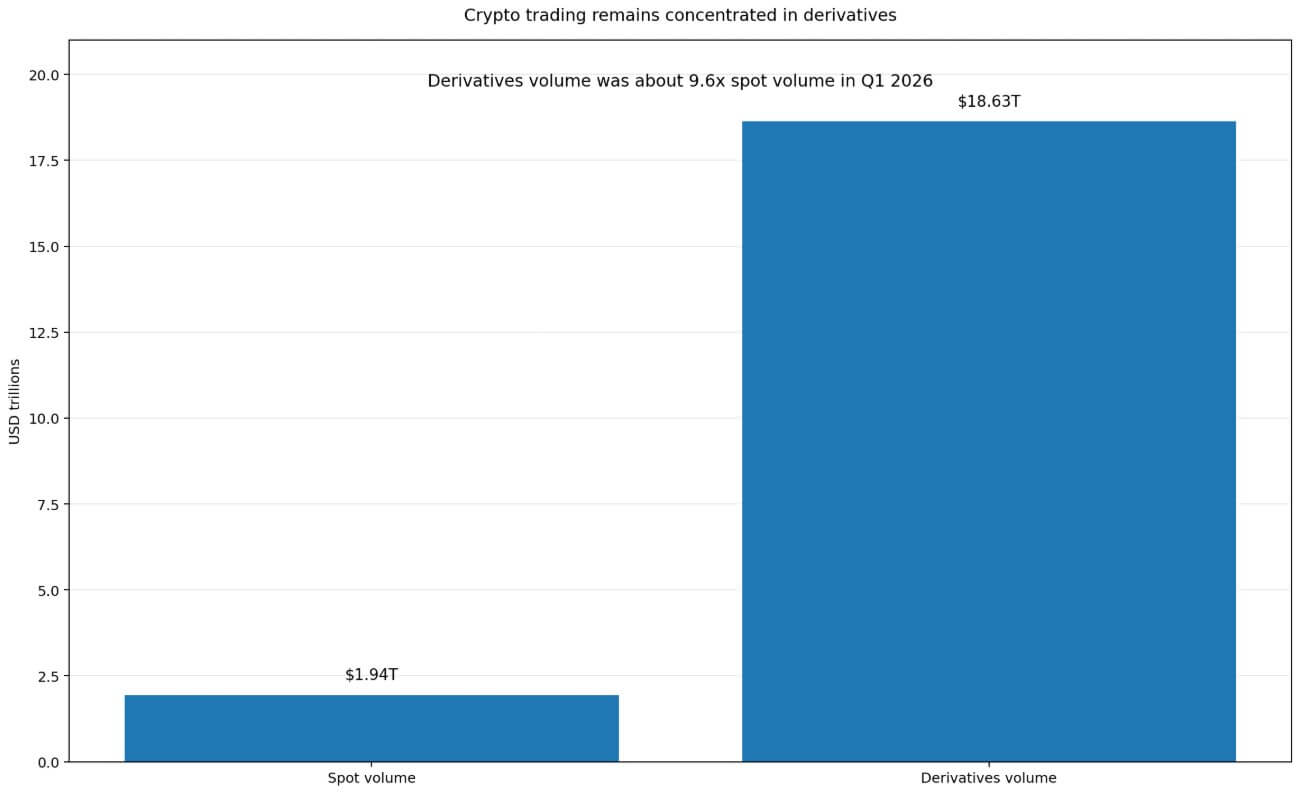
A separate CoinGlass market share report found that crypto trading activity in the first quarter was still overwhelmingly concentrated in derivatives, with roughly $18.63 trillion in derivatives volume versus $1.94 trillion in spot volume.
If no hard float or depth requirements emerge, the practical warning sign for traders becomes a recognizable cluster consisting of top-wallet concentration above 80%, futures-to-spot turnover crossing double digits, extreme negative funding, and price action that corresponds to no identifiable catalyst.
That cluster describes what the three episodes had in common: one wallet cluster controlling an outright majority of supply, real tradable float governing price sensitivity, exchange deposits tied to project-linked wallets preceding the rally, and withdrawals arriving during the forced bid.
Retail shorts who identify that concentration, do the on-chain work, and position correctly can still be right on every fundamental point and lose because their timing is exposed to forced buying they cannot predict.
That asymmetry is a feature of listing perp markets on assets where a small number of wallets can dictate the effective supply available to the cash market.
Major venues have now publicly acknowledged that at least one such episode warranted an investigation.
Credit: Source link