
Bitcoin Notches Its Best Q3 Since 2021: Can It Hold?
Key Takeaways
- BTC is up nearly 11% quarter-to-date, its best Q3 performance since 2021, per Coinglass.
- July alone delivered a 9.8% gain, bitcoin’s best month in about a year, without major Wall Street inflows.
- Bitcoin remains roughly 50% below its October 2025 cycle high of $126,209, tempering the rebound narrative.
A Quarter That Started Ugly and Turned Around
Bitcoin entered the third quarter deep in a hole with the asset falling to its lowest level of 2026 during a brutal stretch in the spring (when it dropped more than 19% in a single week and over 26% across 30 days). The rout saw more than half of all circulating bitcoin sitting underwater at the low.
Bitcoin.com News tracked the asset trading a full 50% below its October 2025 cycle high of $126,209 during that stretch, as bullish catalysts like exchange-traded fund (ETF) demand and institutional accumulation collided with bearish forces including macro tightening and profit-taking from long-term holders.
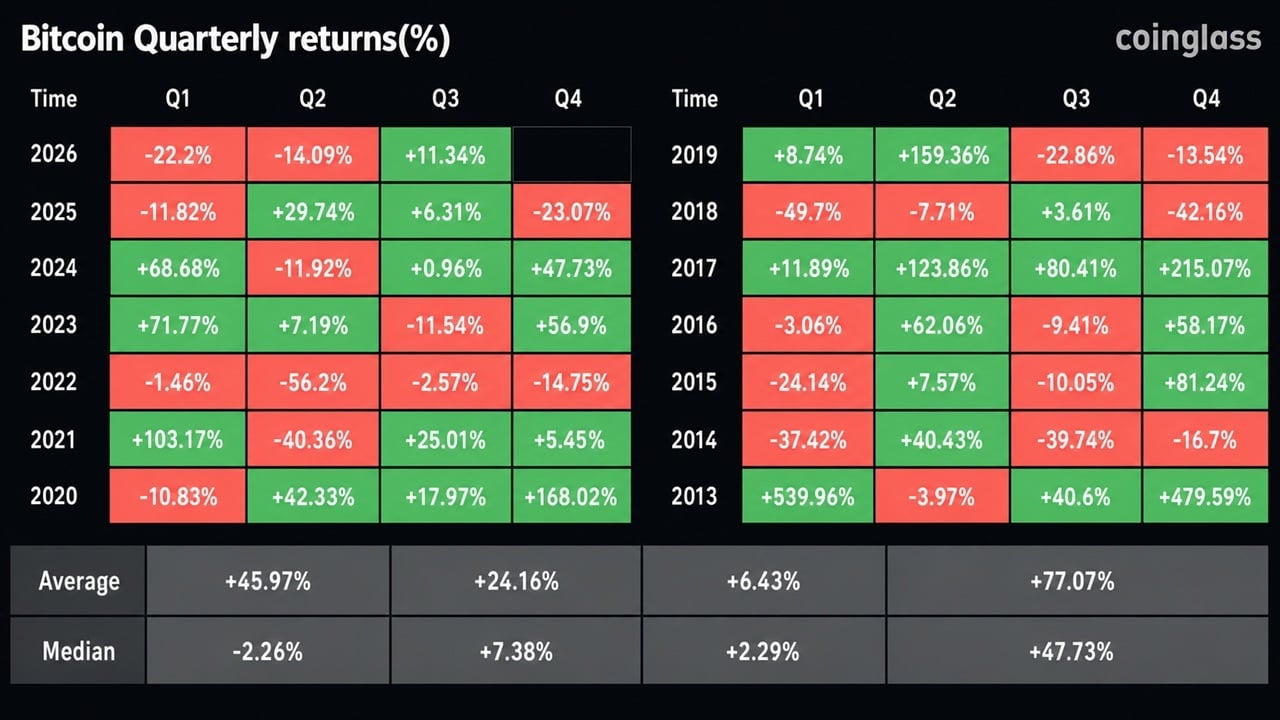
From that low, bitcoin has now clawed back meaningfully and according to quarterly return data tracked by Coinglass, it is up nearly 11% quarter-to-date, marking its strongest third-quarter performance since 2021, when bitcoin gained roughly 25% over the same three-month stretch.
No other Q3 in the years between has come close to matching either number, which is what makes 2026’s rebound notable even though the percentage gain itself is smaller than 2021’s.
July Did Most of the Heavy Lifting
Much of Q3’s strength came in July alone as bitcoin gained about 9.8% for the month, its best single 30-day stretch in roughly a year. What stands out about the July rally is what didn’t drive it, i.e. unlike prior rebounds fueled by heavy spot bitcoin exchange-traded fund (ETF) inflows, this move came largely “without Wall Street’s help,” indicating that the buying pressure originated more from spot and derivatives markets than from a fresh wave of institutional allocation.
To this point, rallies built on broad-based ETF accumulation have tended to attract sustained follow-through buying, while rallies driven more by short covering or thinner spot demand can unwind faster once momentum fades. Bitcoin entered August at roughly $64,040 and has since found support in the $64,500 range, currently trading above $65,000 since last week (within a narrow but stable band compared to the sharp swings that defined the second quarter).
Miners Add a Floor, and a Ceiling
Bitcoin’s mining sector offers another data point on where the market’s stress level currently sits. To this point, the asset trading near $63,500 puts miners roughly at their production cost, meaning further downside risks push some operations toward break-even or worse. Historically, prices hovering near miner break-even levels have acted as a rough floor, since forced selling from unprofitable miners tends to taper off, even as it also caps enthusiasm about the rally extending sharply higher without a fresh catalyst.
The bigger question hanging over Q3’s gains is seasonality. August has historically been one of bitcoin’s weaker months because since 2013, the average August return sits at just +1.12%, while the median return is closer to -7.49%, reflecting how a handful of strong Augusts skew the average despite most years finishing negative.
Only two prior Augusts have posted standout gains (roughly +30% in 2013 and +13.8% in 2021), meaning the historical base rate favors consolidation or a pullback rather than a continuation of July’s strength.
Forecasts circulating ahead of August pointed to a possible washout toward the $55,000–$60,000 range later in the quarter, driven by deteriorating valuation metrics like the MVRV Z-score moving deeper into negative territory alongside broader macro anxiety. If that scenario plays out, it would erase a meaningful chunk of Q3’s current gain before the quarter closes.
Credit: Source link