API3 Price Prediction: API3/USD Trade Tempts Mooning
Join Our Telegram channel to stay up to date on breaking news coverage
API3 (API3) Price Prediction – November 3
As of the moment of writing these analytics, the API3 trade activity tempts mooning versus the purchasing power of the US Dollar. Buying and selling in the crypto trade have high and low-value lines between $2.41 and $1.86 at an average rate of 13.69 percent positive.
API3/USD Market
Key Levels:
Resistance levels: $2.50, $3, $3.50
Support levels: $1.50, $1, $0.50
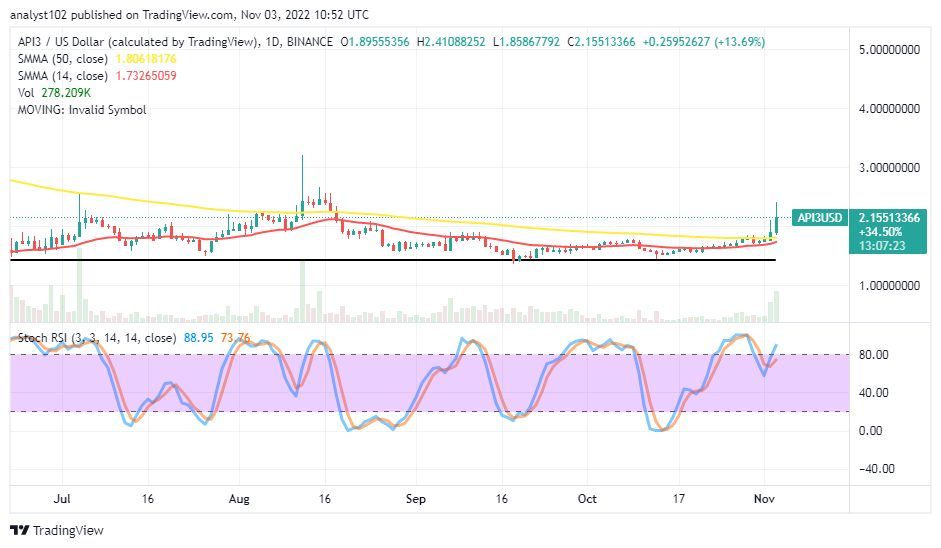
API3/USD – Daily Chart
The API3/USD daily chart showcases the crypto trade tempts mooning after breaking past the trend lines of the SMAs recently. The horizontal line is drawn beneath the trading indicators, marking a point around the $1.42 level to showcase the spot from which the price has kept upward over time. The 14-day SMA indicator is around $1.7327, below the $1.8062 value line of the 50-day SMA indicator. The Stochastic Oscillators are trying to cross back northbound against the 80 range to the position at 73.76 and 88.95 range values.
Will the API3/USD market rise higher than prior highs attempted?
Though, the current trading outlook in the API3/USD market operation portrays the crypto trade tempts mooning in a bid to reach some of the last previous peaks. A sustainable explosive push has to occur against those former high points before bulls can be proud of trading in another higher-trading spot afterward. In the wake of that sentiment coming forth, long-position placers should be wary of any retrace that can emanate alongside.
On the downside of the technical analysis, short-position placers have to be on the lookout for fearful rejections possibly, after today’s trading candlestick formation. The $2.50 to $3 resistance levels will have to serve as the areas at which bears are most likely to regain control of the cryptocurrency market. A convergence of candlesticks seems not realistic as usual around the value lines before a downward-trending force can resume.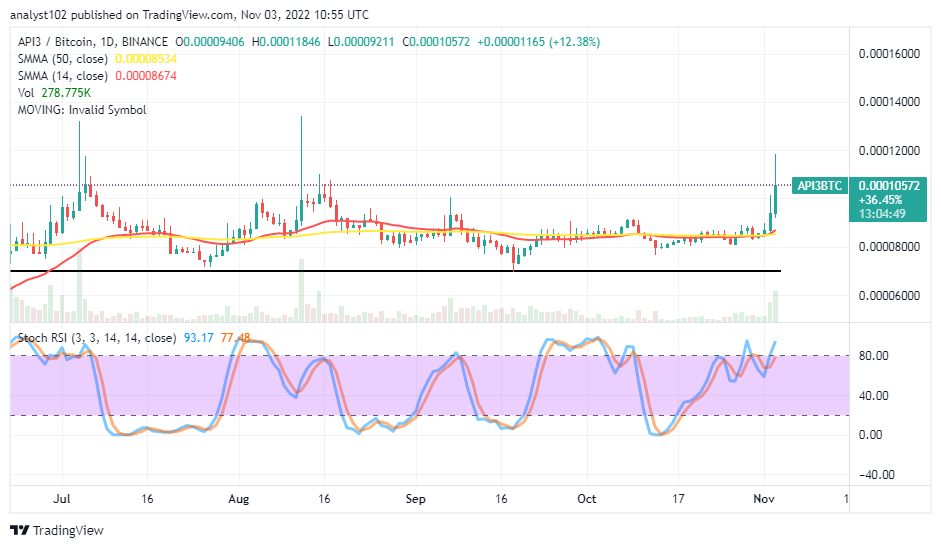
API3/BTC Price Analysis
In comparison, API3 trade operation tempts mooning against the trending weight of Bitcoin. The former trading instrument has been somewhat erratically when it comes to surging higher, pairing with its latter. In a conjoining pattern, the 50-day SMA and the 14-day SMA have been heading eastward. The Stochastic Oscillators have been swinging closely around the 80 range. But, they have now swerved northbound briefly into the overbought at 77.48 and 93.17 range values. There has been a sign of a top shadow in the emergence of the current bullish candlestick, serving a warning signal against seeing the base crypto maintaining sustainable highs while any spike further attempted sooner.
Dash 2 Trade (D2T) to be Listed on LBank Soon
In its presale, Dash 2 Trade raised more than $4 million and disclosed that LBANK Exchange would be the first CEX to offer its D2T token for sale. After beginning its open token sale, the business only recently reached this threshold
Related
Dash 2 Trade – High Potential Presale
- Active Presale Live Now – dash2trade.com
- Native Token of Crypto Signals Ecosystem
- KYC Verified & Audited
Join Our Telegram channel to stay up to date on breaking news coverage
Credit: Source link