
Bitcoin Price Teeters Near $80K as Global Stock Rout Rattles Markets
Key Takeaways
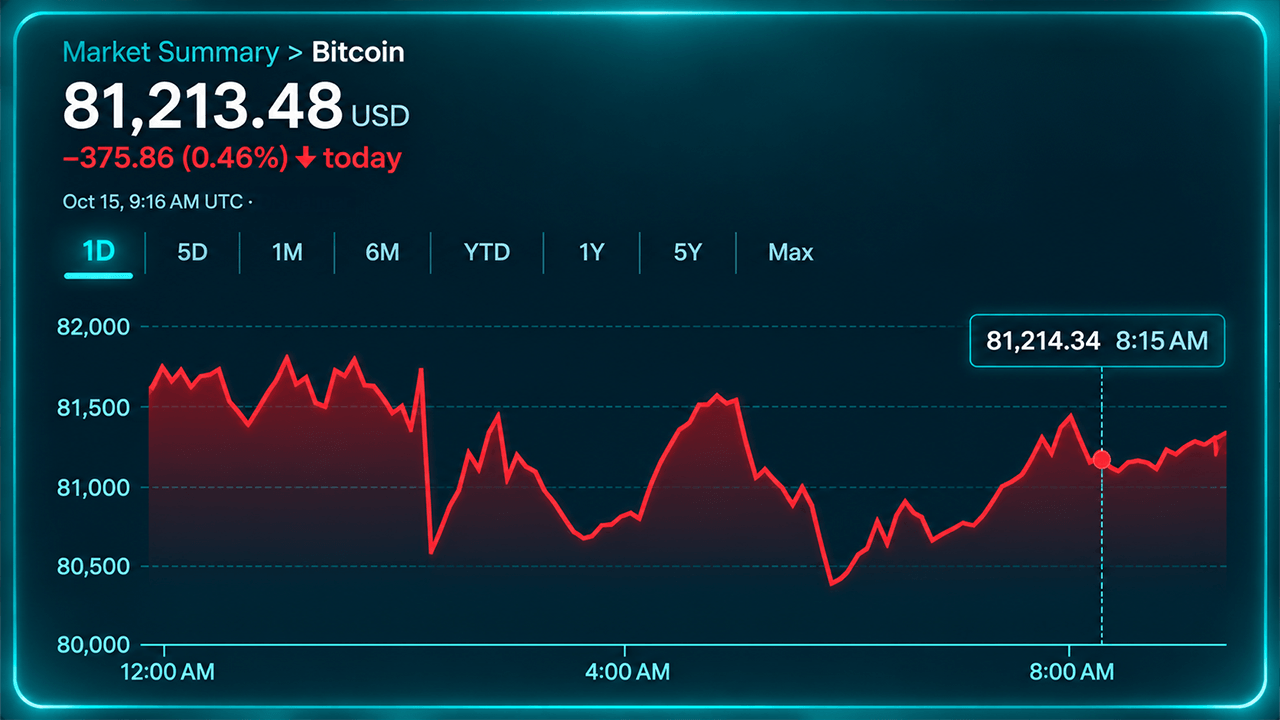
- Bitcoin’s price is struggling to find its footing near $81,200 after a sharp retreat, with the $80,000 level emerging as the next major test for buyers.
- Asian stocks took a beating, led by steep losses in South Korea and Japan, as inflation worries and technology-sector selling rattled global markets.
- Bitcoin’s short-term technical indicators still favor the bears, although longer-term moving averages suggest buyers haven’t completely lost their footing.
Bitcoin’s $80,000 Defense Faces a Test as Bears Keep the Upper Hand
At press time, bitcoin’s price is clinging to the low-$81,000 range after a bruising retreat from $84,000, and the technical picture suggests the market hasn’t finished wrestling with its recent losses. At approximately 5 a.m. EDT on Thursday, bitcoin traded near $81,246, commanding a $1.633 trillion market capitalization and $41.22 billion in 24-hour volume, while its $80,154 to $83,791 daily trading range illustrated just how much ground buyers and sellers have contested as the $80,000 psychological threshold approaches another consequential examination.
The cryptocurrency’s difficulties coincide with a punishing session for Asian equities and weakness across European markets, according to the supplied market report. South Korea’s Kospi dropped roughly 7.6% to 8%, triggering circuit breakers, while Japan’s Nikkei 225 shed nearly 5%. Taiwan’s Taiex declined approximately 3%, and China’s Shanghai Composite slipped around 1.5%. European shares also faced significant selling pressure, with the Stoxx 600 down approximately 0.35% and its technology sector losing 3.2%. Hotter-than-expected inflation, elevated borrowing-cost expectations and selling across semiconductor shares have contributed to the broader retreat from risk.
Hourly Chart Shows Buyers Struggling to Regain Control
The one-hour chart captures bitcoin’s retreat from approximately $84,044 to a low near $80,154, followed by a tentative recovery toward $81,200. The latest candles suggest consolidation rather than a convincing reversal, with immediate resistance concentrated between $81,500 and $81,800.
Buyers have managed to stabilize the market above the session’s deeper lows, but the recovery lacks the momentum necessary to overturn the bearish structure. Another rejection below $81,800 would place $80,500 back on the radar, followed by the closely watched $80,150 support area.
Four-Hour and Daily Charts Keep Bears in Charge
The four-hour chart offers little comfort for traders anticipating an immediate recovery. Lower highs continue to characterize the broader structure, while repeated failures to sustain advances above $83,500 reveal persistent selling interest.
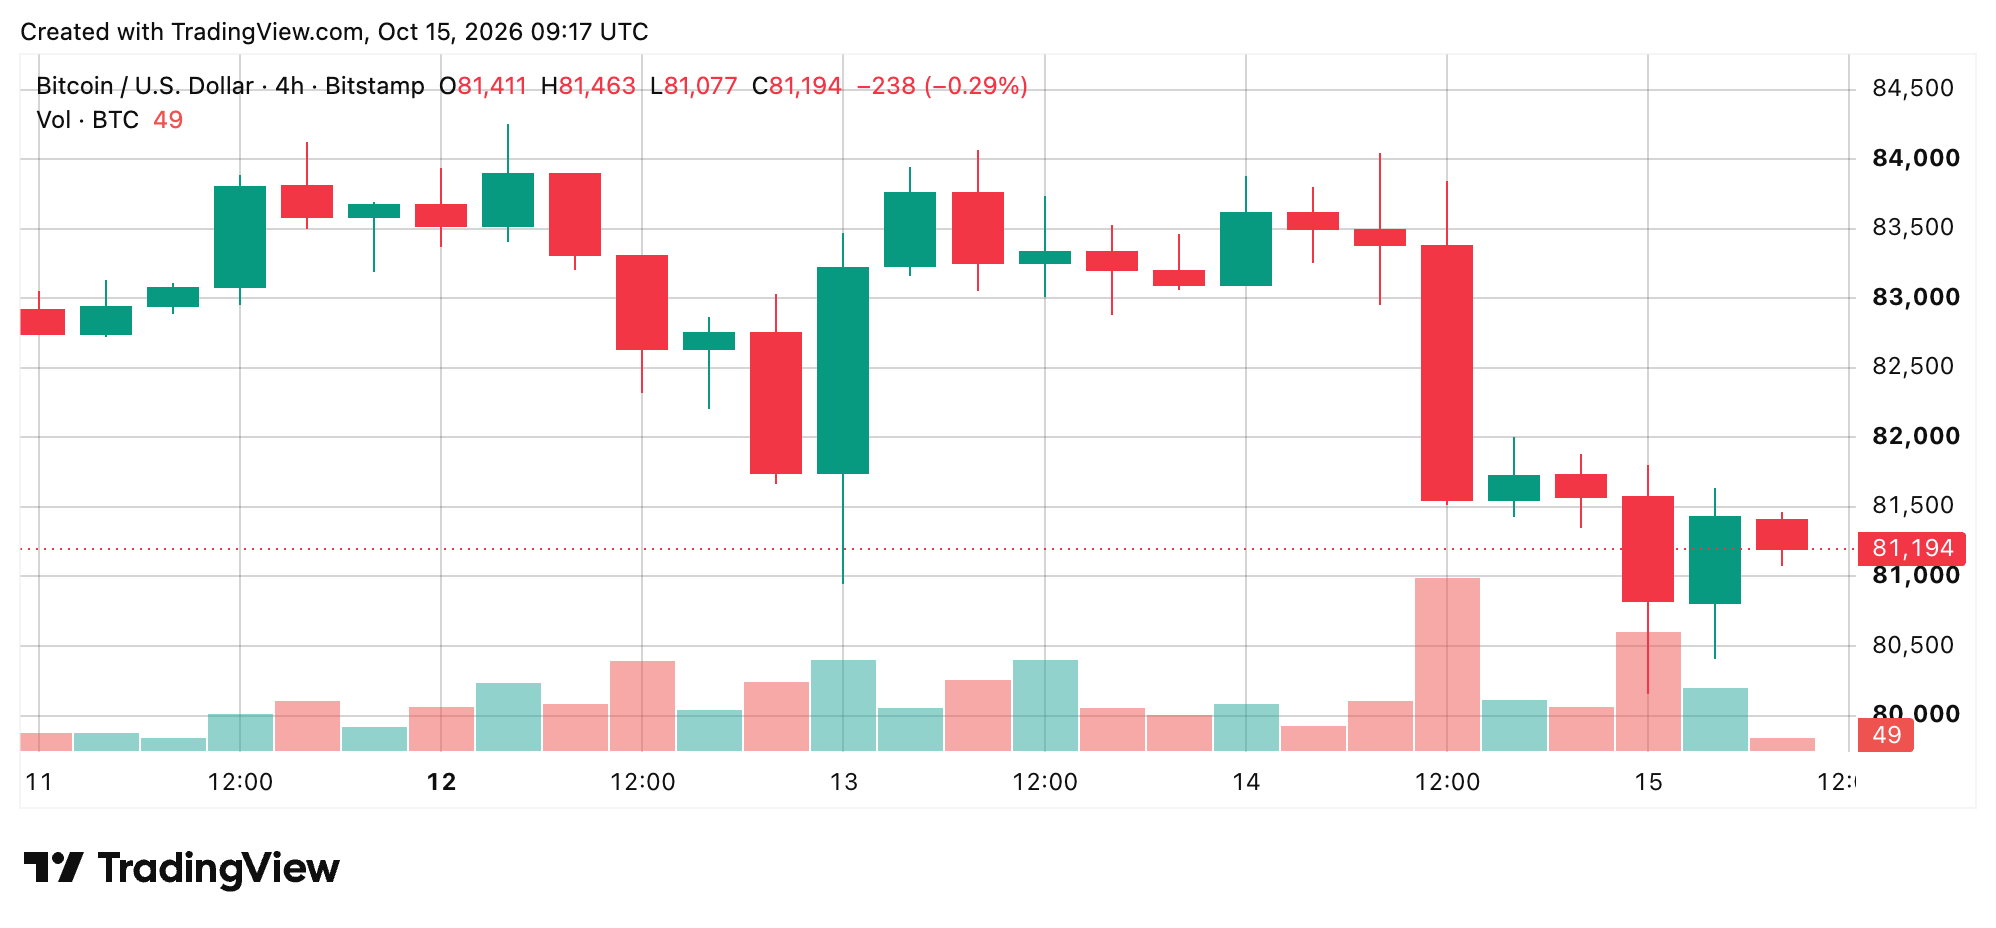
A pronounced bearish candle accompanied by elevated trading volume reinforces the significance of the recent breakdown. Reclaiming $82,000 would represent an initial improvement, although $82,500 remains the more consequential recovery threshold. Until those levels are recovered, the evidence favors corrective rebounds rather than a decisive change in direction.
The daily chart presents an equally demanding assignment for buyers, with bitcoin surrendering much of its previous advance from $74,913 to $87,374. Recent candles reflect deteriorating momentum, leaving $80,000 as the principal defensive line.
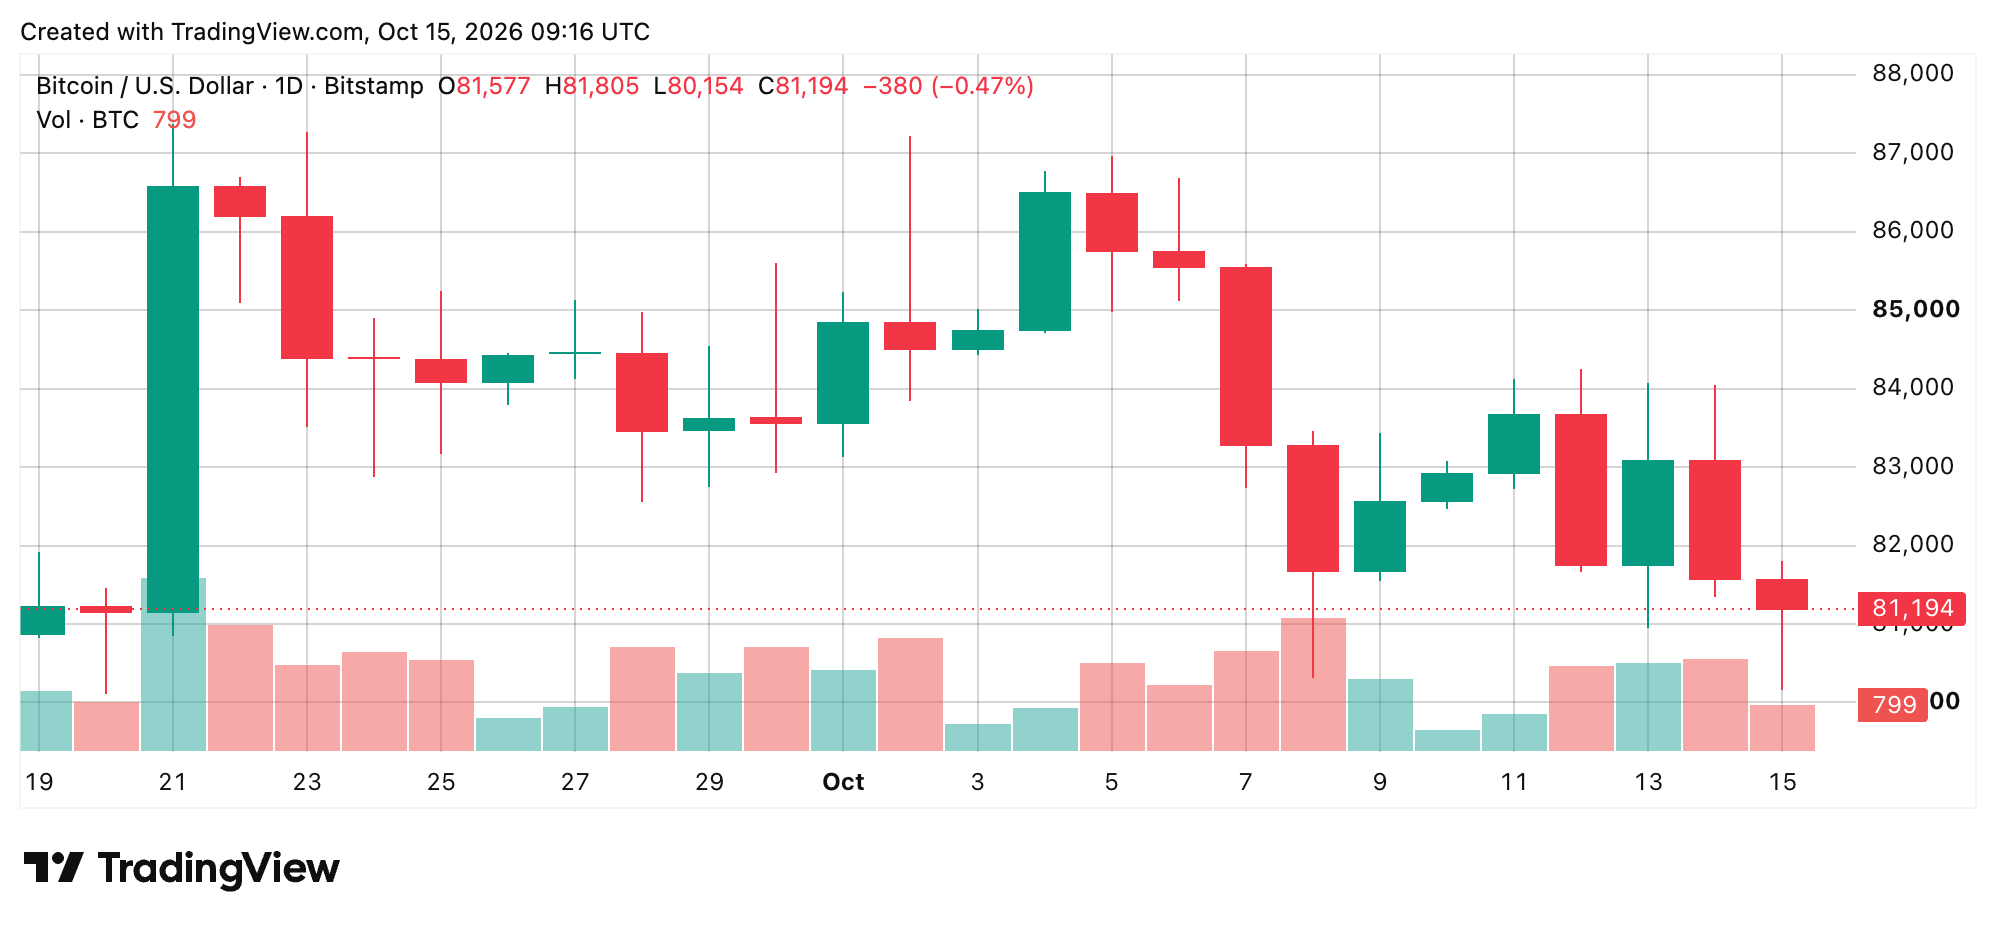
A daily close below that psychological barrier would expose $79,000 and potentially $78,000, while a sustained recovery above $81,800 would improve the immediate outlook. The larger technical question is whether buyers can establish a durable floor before the latest selling pressure develops into another downward extension.
Oscillators and Moving Averages Deliver Mixed Signals
Bitcoin’s oscillators remain predominantly neutral despite the recent retreat. The relative strength index (RSI) stands at 46, while Stochastic registers 25, and the commodity channel index (CCI) reads minus 163.
The average directional index (ADX) sits at 26, suggesting some directional strength without independently establishing its direction. Momentum registers a positive signal at minus 4,516, although moving average convergence divergence (MACD) remains negative at 266. The ultimate oscillator (UO) reads 43, reinforcing a market where bearish pressure persists without unanimous confirmation across indicators.
The daily chart’s moving averages (MAs) tell a more distinctly bearish short-term story. Bitcoin trades beneath the 10-period exponential moving average (EMA) at $82,635 and the 20-period exponential moving average (EMA) at $82,801, while the 20-period simple moving average (SMA) stands higher at $83,662.
Longer-term readings remain constructive, with the 50-period exponential moving average (EMA) at $80,297 and the 200-period simple moving average (SMA) at $72,282. That division leaves traders confronting a market whose immediate direction remains weak despite a more supportive longer-term foundation.
| 🐂 Bull verdict | 🐻 Bear verdict |
|---|---|
| A sustained recovery above $81,800 would strengthen the bullish case and open the door to $82,500, followed by a potential advance toward $83,000. Reclaiming $84,000 would represent a more meaningful technical improvement, suggesting buyers have regained control of the immediate trend and established a foundation for another upward attempt. | Failure to defend $80,500 would invite another examination of the $80,150 support area, where buyers previously managed to halt the decline. A decisive breakdown beneath $80,000, particularly on elevated trading volume, would reinforce bearish momentum and expose $79,000, with $78,000 emerging as the next consequential downside target. |


Credit: Source link