Post a 9% dip, XRP traders need to watch out for these levels
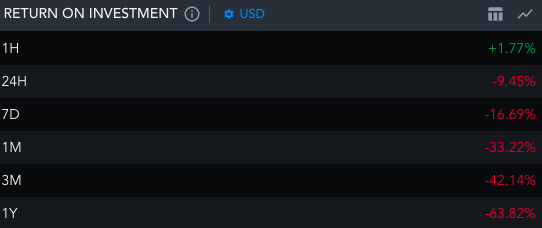
Owing to the macro-bearishness, XRP HODLers have been fetching negative returns for quite some time. Over the past week, their investment size shrunk by 17%, while on the quarterly and yearly window, the same was down by 42% and 64%.
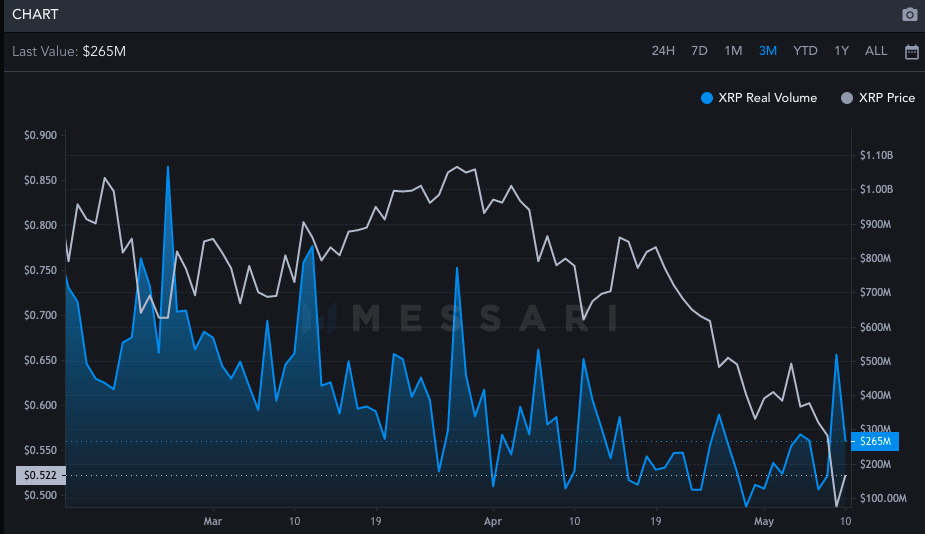
XRP’s volume has been more towards the downside of late. From hovering around $800 million in February, the volumes are down to the $200 million brackets, bringing to light the eroding interest of market participants in Ripple’s XRP.
XRP: What to look out for?
The 9% daily dip brought XRP down to the $0.5 range. At press time, the token was seen hovering quite close to its 200-day moving average [red]. The said level has acted like quite a strong support on multiple occasions in the June-July period last year. Since then, XRP’s price has not breached below the said mark.
However, with the broader bearishness and deficient demand in the market, XRP is currently on a slippery slope. Losing the aforesaid level as support could push the token’s valuation down to $0.41-$0.42. Post that, if the market continues to remain oversold, then XRP could meltdown to $0.27.
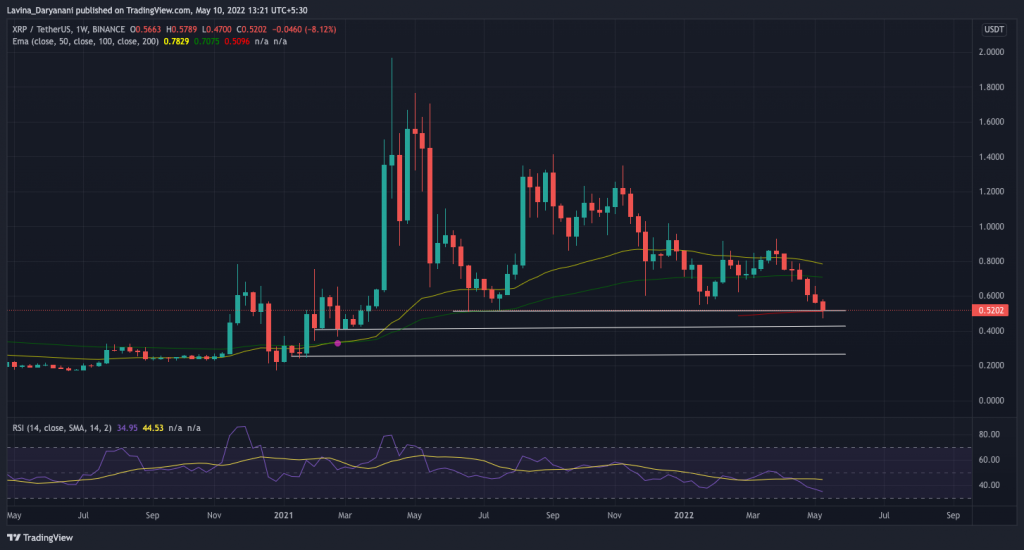
On the flip side, if the macro-recovery kicks in, then XRP could climb up to $0.705 [green line] using its current support. However, the said incline wouldn’t happen within a couple of trading sessions. It would be gradual and paced out.
Credit: Source link