Bitcoin’s top and bottom correlation with gold, the S&P 500, and US property


Data analyzed by CryptoSlate showed a degree of relationship between Bitcoin tops and bottoms in relation to those of gold, the S&P 500, and the S&P Case-Shiller Home Price Index (CSHPI).
Bitcoin versus others
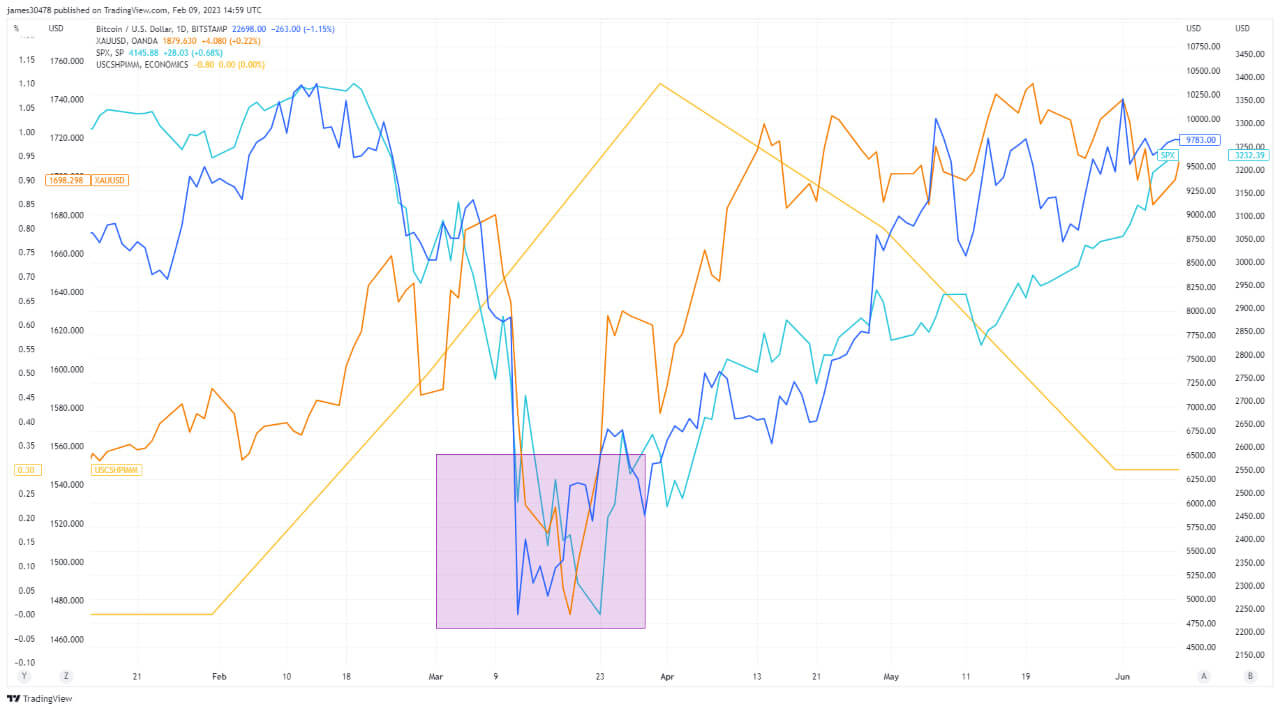
The chart below interlays the price of BTC, gold, the S&P 500, and CSHPI. It was noted that when Bitcoin bottomed during the covid crash in March 2020, the price of the other three assets/indices also bottomed soon after, except for CSHPI.
Examining the tops on an expanded timeframe also shows mixed results for BTC as a leading indicator. Bitcoin topped $69,000 in November 2021, the S&P 500 followed by the year-end, followed by the CSHPI, which peaked in January 2022.
However, gold had topped at $2,070 around August 2020, some 15 months prior to BTC topping.
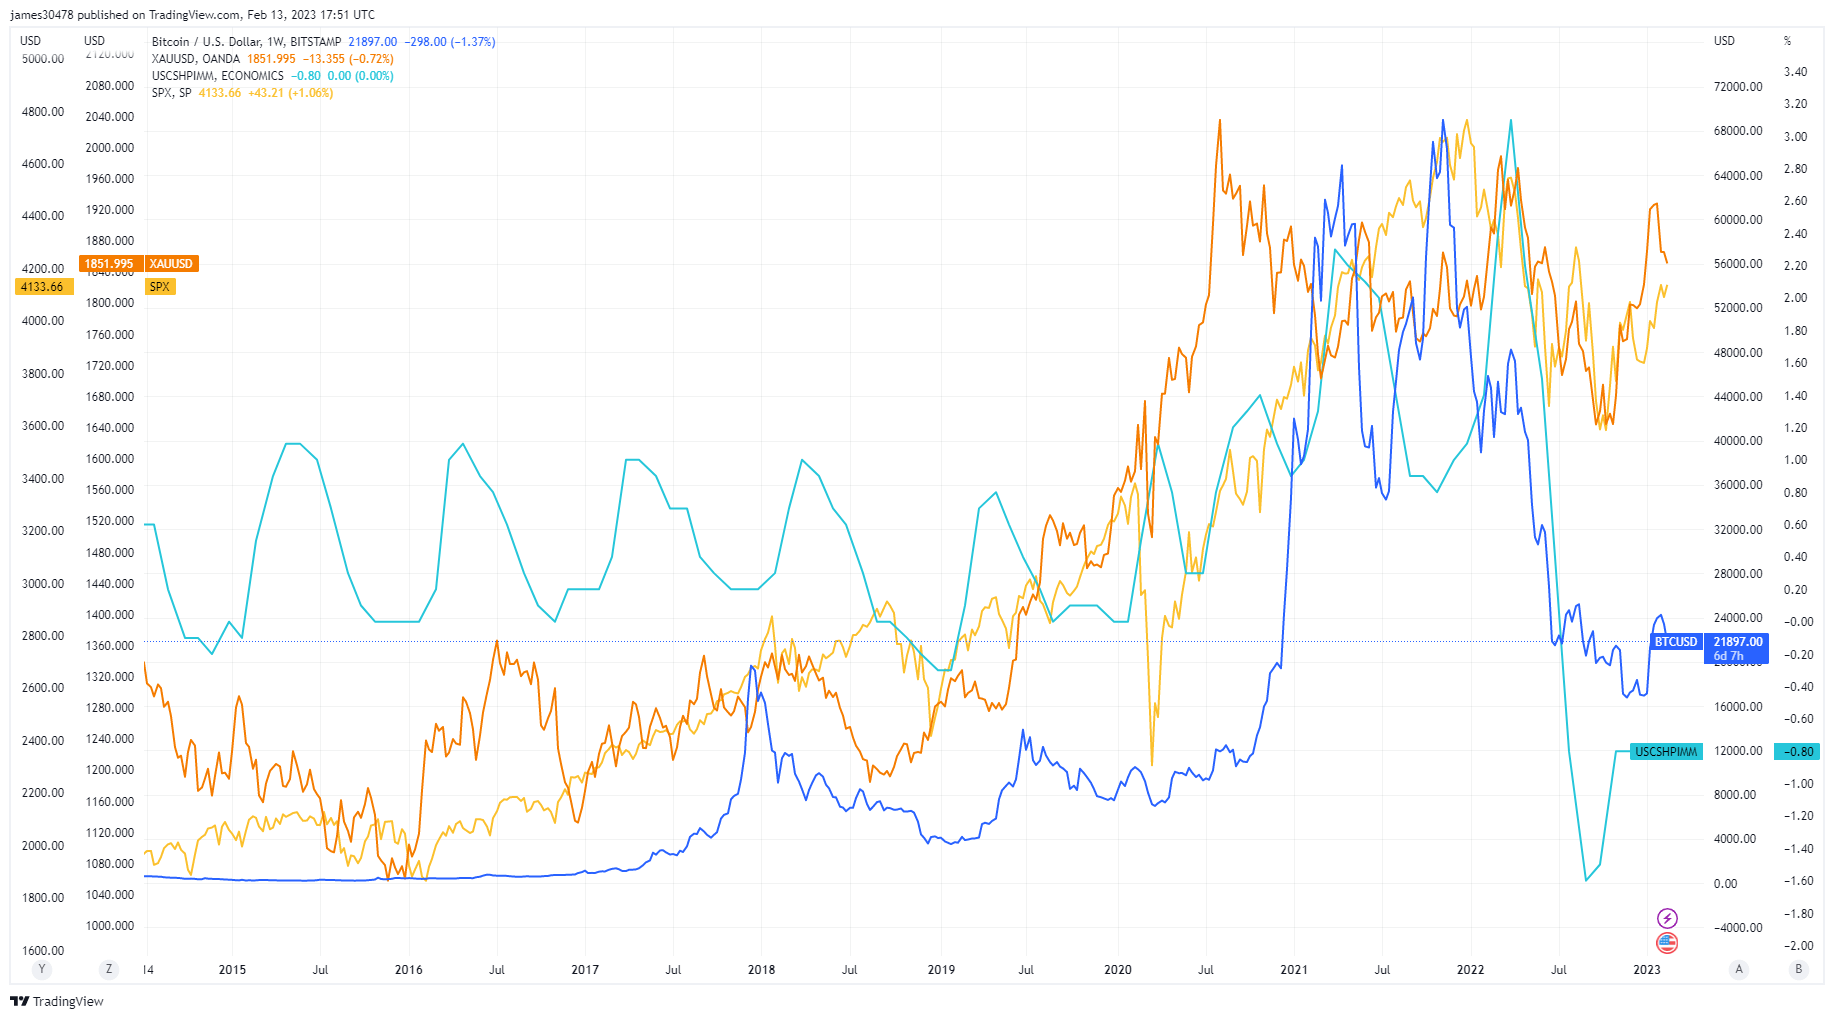
In summary, the data points to a high degree of bottoming correlation between Bitcoin, gold, and the S&P 500, but not U.S. property. The covid period was a black swan event that would have exerted sell pressure among liquid asset classes.
Regarding topping, Bitcoin displayed a strong degree of correlation with the S&P 500 and the CSHPI, but not with gold.
Credit: Source link