
Bloomberg Sees Bitcoin Price at $10K and Cryptoquant’s CEO Doesn’t Agree
Key Takeaways
- Bloomberg’s Mike McGlone said recently that bitcoin could revert to $10,000 if U.S. stocks drop 20%.
- Cryptoquant’s Ki Young Ju countered that $58B in ETF inflows and 1.3M treasury BTC imply a $30K floor.
- The next test is whether the Nasdaq 100, already 6.5% off its Oct. 6 high, slides toward McGlone’s 20% trigger.
McGlone’s Domino Theory
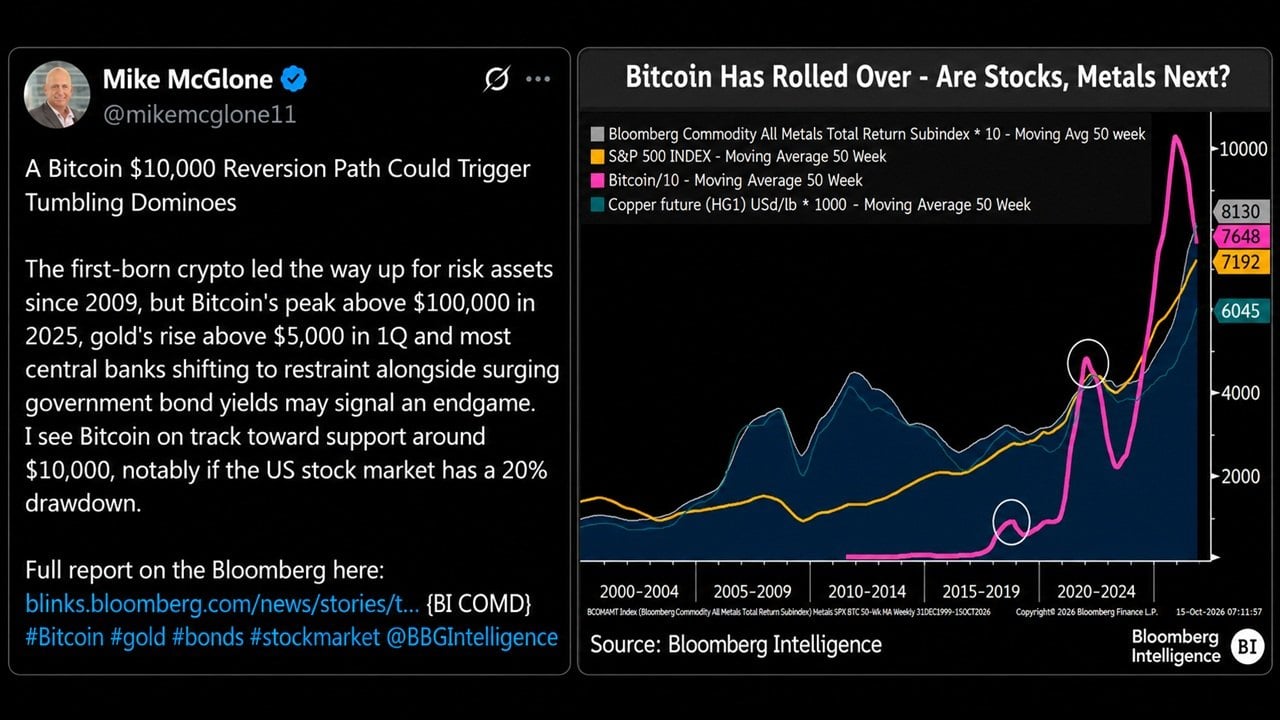
McGlone laid out the call in an X post yesterday, previewing a Bloomberg Intelligence report titled “A Bitcoin $10,000 Reversion Path Could Trigger Tumbling Dominoes.”
His argument is that bitcoin’s peak above $100,000 in 2025, gold’s rise above $5,000 in the first quarter and most central banks shifting to restraint while government bond yields climb “may signal an endgame.” He added:
I see Bitcoin on track toward support around $10,000, notably if the US stock market has a 20% drawdown.
The same morning, McGlone shared a companion chart arguing that bitcoin’s 50-week moving average is heading down “akin to 2022-23” while in a separate note, he suggested a U.S. Treasury five-year yield near 5% may simply be “too much” competition for non-income-producing assets like bitcoin and gold.
This isn’t new territory for him as earlier in April, McGlone warned podcast listeners, “I see a hurricane coming in,” and said bitcoin could fall to $10,000 this year (adding that holding above $75,000 would prove him wrong).
When onchain analyst Willy Woo pushed back on Friday, McGlone simply replied that they should “check in a year from now.”
$30,000 Is Ki Ju’s Floor Math
Ki Young Ju, chief executive of onchain analytics firm Cryptoquant, didn’t buy McGlone’s assertions and, in a direct reply to the Bloomberg analyst, pointed out that exchange-traded funds (ETFs) have brought in $58 billion and that treasury companies hold 1.3 million BTC. Even if all of that capital is left, Ju argued, onchain cost basis would still put the floor near $30,000.
His second point leaned on MVRV, short for market value to realized value. The metric compares bitcoin’s market price with the average price at which every coin last moved onchain, and a reading below 1 means the average holder is underwater. Consequently, by Ju’s math, a $10,000 bitcoin would mean an MVRV of 0.2, while the worst bottom in the asset’s history printed 0.6. He further added:
You would need 2019 buyers to panic, and they have already survived two 75% crashes.
Lastly, Ju told his followers that McGlone’s chart plots bitcoin divided by 10, so the “10,000” on its axis is really $100,000. He added that McGlone “has been calling for a return to $10,000 since 2023 and repeated it in June and August this year.”
Fidelity’s Line in the Sand
Fidelity’s director of global macro, Jurrien Timmer, landed in a third camp entirely, posting the following message late yesterday:
A new 4-year cycle bull market could be underway, based on its power law patterns. There doesn’t seem to be a narrative, but then again, bull markets rarely start with one.
His accompanying chart, with data accurate as of Oct. 11, put bitcoin’s power law support line at $56,488 and marked the last cycle peak at $122,765 (weekly). Bitcoin sat at $82,976 when the data was cut, roughly 47% above that support.
In any case, McGlone’s trigger is the one to watch given that the Nasdaq 100 closed down 2.5% on Friday and now sits 6.5% under its Oct. 6 high, still a long way from a 20% drawdown. Bitcoin.com News reported this week that Glassnode sees bitcoin’s $80K safety net eroding, while Michael Saylor argued the bottom is in.
Prediction markets, meanwhile, continue to give a return to the $100,000 range just a 27% chance. Interesting week ahead!


Credit: Source link